The Illinois app is the University of Illinois Urbana-Champaign’s official campus app. The app benefits the whole university community including the student body, faculty and staff, alumni, and visitors. The Illinois app is part of the Rokwire project, led by the Smart, Healthy, Communities Initiative. Rokwire is an open source platform for creating mobile apps.
CAMPUS VISITS
Promoting an inclusive campus tour experience within the Illinois app
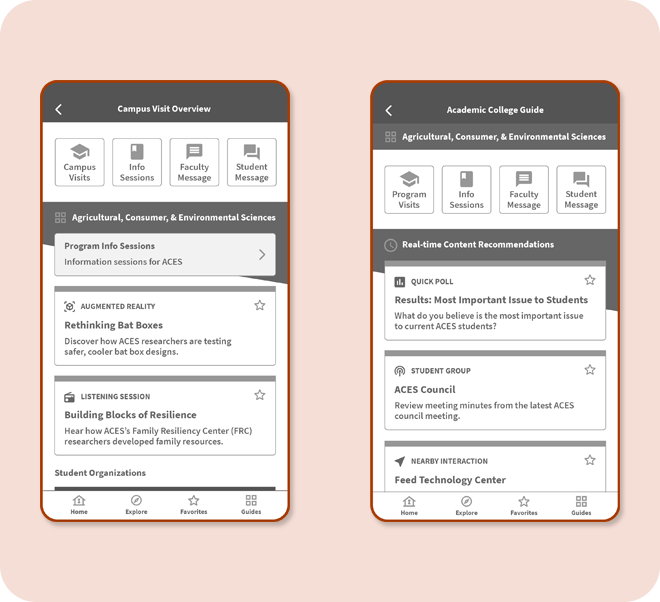
SUMMARY
Evaluative research studies on campus visit app content informs an iterative approach to user experience design
In determining the product road map for the Illinois App, the Smart, Healthy, Communities Initiatives Office at the University of Illinois is soliciting app ideas and feedback. One of the primary focuses is elevating the campus tour experience for those who are on campus and those who are off campus. My roles on the project included project planning, research method development, data analysis, data synthesis, concept development, and usability testing. The duration of this project was two weeks in March 2022.
Goal One: Account for content and user interactions on disparate systems across the university
Goal Two: Leverage embedded device technologies to distribute engaging content in relevant and timely fashion
Goal Three: Enable prospective and current students to find interest communities
MARKET RESEARCH
To collect stakeholder perspectives on current campus visit experiences, a variety of tools aided the discovery process. These tools include Instagram, Qualtrics, and ChalkMark by Optimal Workshop. To compress the research and design timelines of the project, two design sprints provided the necessary mechanisms. This weekly approach provided the opportunity to collect continuous feedback.

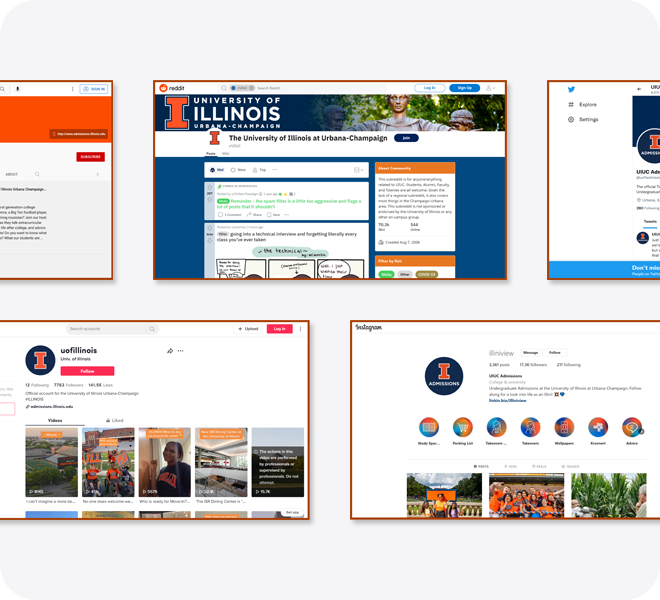
The discovery process contains distinct primary and secondary research methods ranging from comparative analysis of peer institutions to content analysis of University of Illinois Urbana-Champaign partner websites.
USER RESEARCH
To collect initial attitudinal research on the campus visit experience, a logic-based survey reached 4,357 people on Instagram and resulted in ten responses. This approach of using social media as a survey recruitment tool provided the opportunity to conduct more studies. Data collection applies to a gradient of stakeholder groups including high school students, transfer students, high school staff, university staff, and parents or guardians of students.
Discovery Survey One | College Information
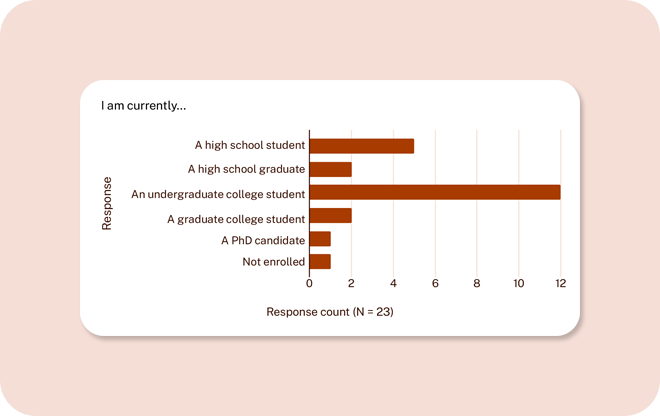
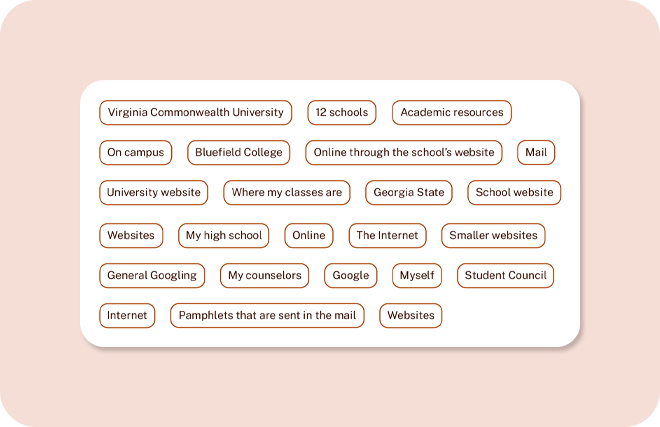
To collect information on the topic of college information gathering, a survey reached twenty-three participants. Participants of this study were students from the United States.
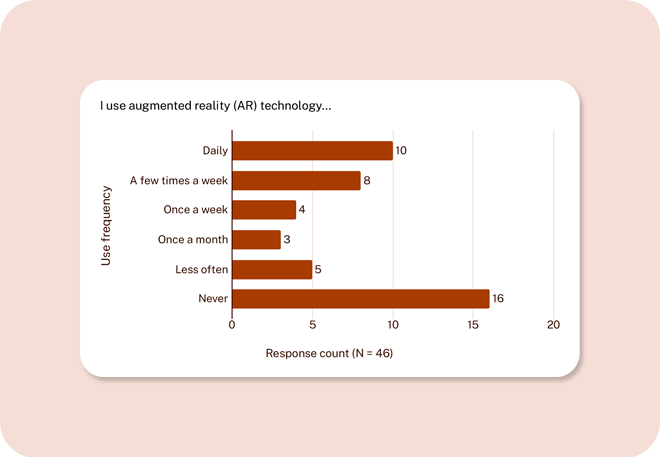
Discovery Survey Two | Augmented Reality
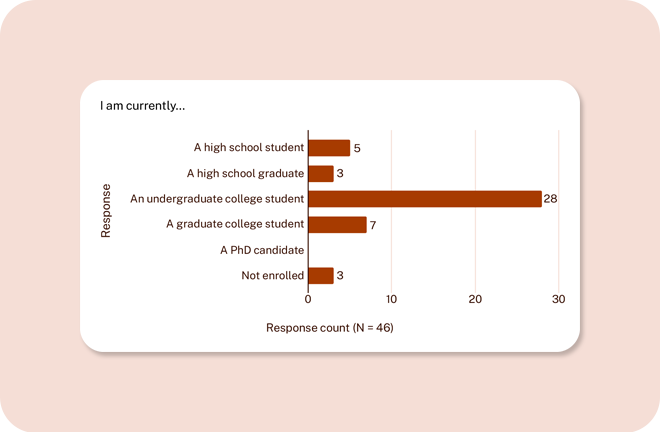
To collect information on the relationship of augmented reality and college campuses, a survey reached forty-six participants. Participants of this study were students from the United States.
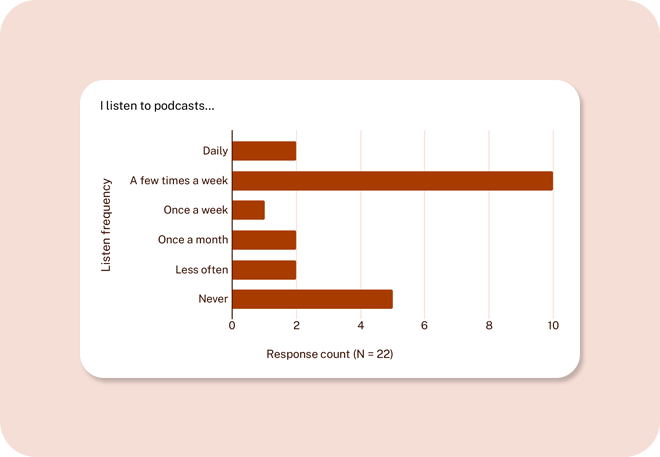
Discovery Survey Three | Podcasts
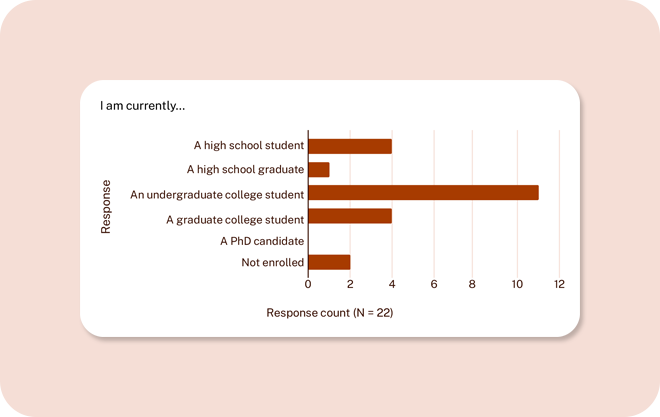
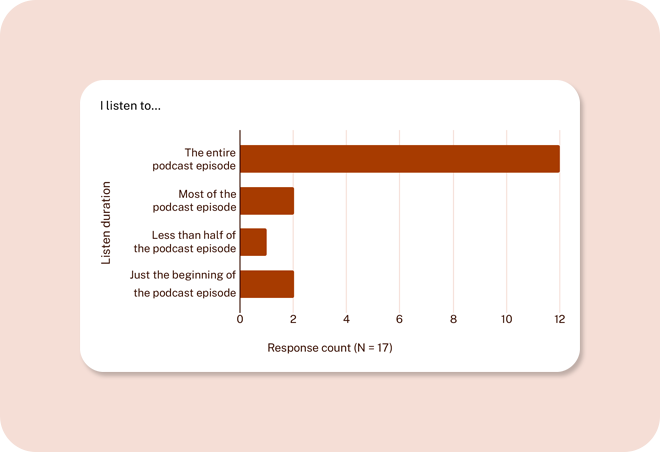
To collect information on the topic of podcasts, a survey reached 22 participants. Participants of this study were students from the United States.
DESIGN CONCEPTS
The synthesis of the discovery dataset illustrated the opportunity to design and evaluate three content-based campus visit experiences that meet and exceed user expectations. To minimize development time associated with the Campus Visits section of the Illinois App, the established pattern library communicates new forms of content interactions. With the emergence of content distribution patterns, multiple concepts explore the notion of location-agnostic content related to the discovery of relevant campus experiences. Qualitative and quantitative user feedback collected from evaluative and generative sessions provided the opportunity to identify areas of refinement in conceptual wireframes.
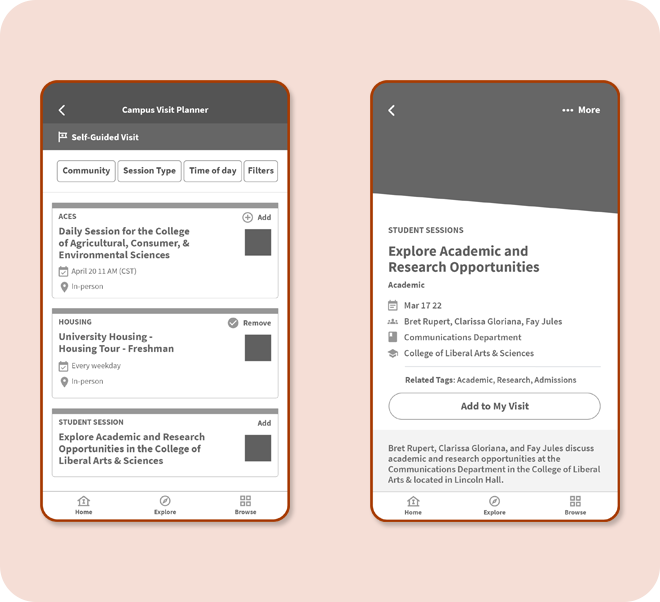
To provide flexibility when learning about the University, the campus visit planner encourages students to select tour sessions based on personal interests.
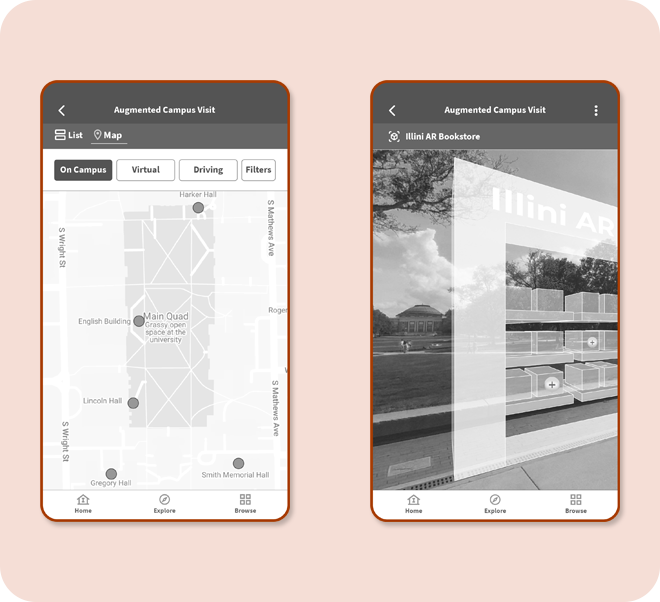
Looking to the future, the augmented campus visit brings campus landmarks and content to prospective students who are on campus or off campus.
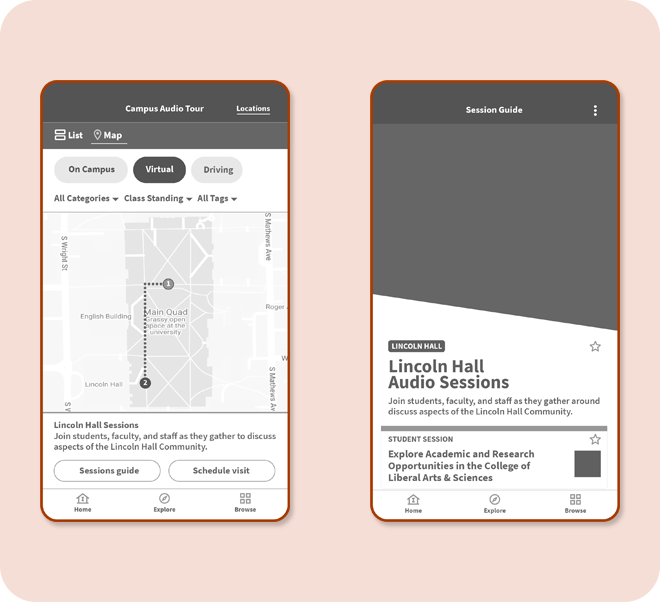
With the increase in audio-based content consumption, the audio tour experience accommodates prospective students who are on campus or off campus.
USABILITY STUDIES
To collect information on the usability of the three concepts, a first click study reached around twenty participants each. Participants were students from United States. Each participant completed a series of four tasks.
Study One | Campus Visit Planner
Task One | Finding sessions
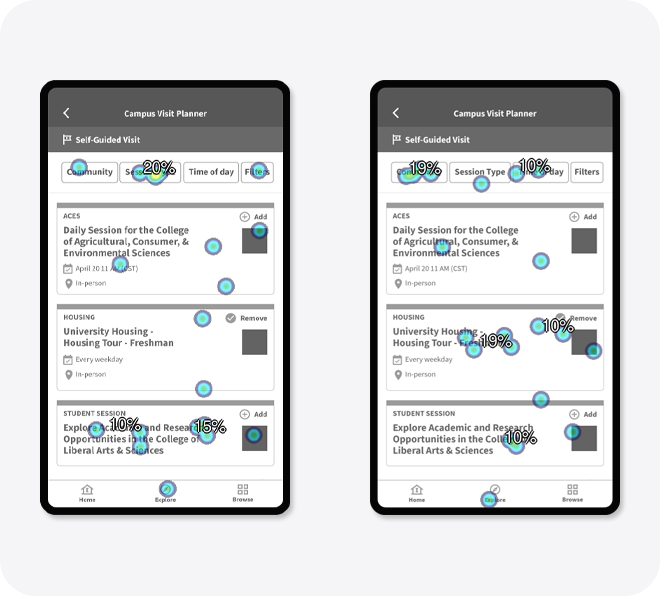
The first task of the study asks participants to connect with digital elements (below, left image). The two successful areas include the session type button and the filters button. The exact task is “While planning a visit, you would like to view sessions on career perspectives of recent graduates. Where would you go to find available sessions on career development?”
For task one (below, left image, N=20), the success rate for task one was 25% with the average time taken at 11.39 seconds. Four participants clicked the session type. One participant clicked the filters button.
Task Two | Meeting with a current student
The second task of the study asks participants to meet a current student (above, right image, N=20). The one successful area is the back arrow. The exact task is “While planning a visit, you would like to meet with a current student in your area of study. Where would you go to sign up to meet a student?”
For task two (above, right image, N=20), the success rate for task two was 0% with the average time taken at 6.96 seconds.
Task Three: Accessing a saved session
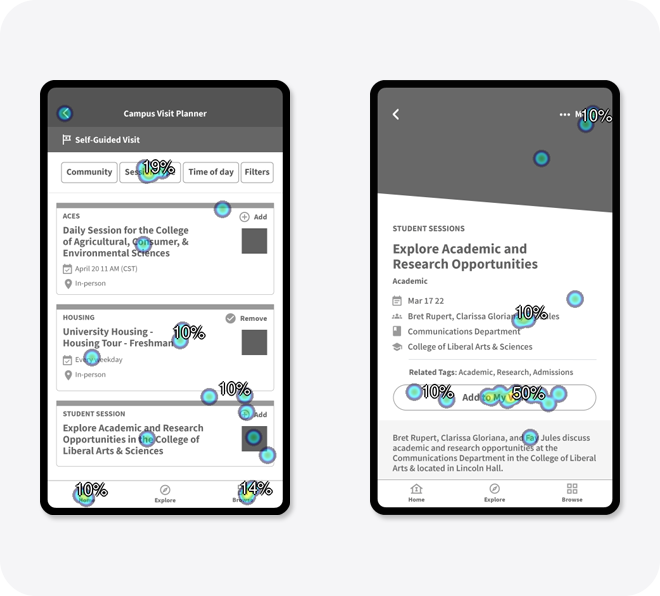
The third task of the study asks participants to access a saved session (below, left image, N=20). The one successful area is the back arrow. The exact task is “While browsing sessions, you saved a session for future reference. Where would you go to access a saved session?”
For task three (below, left image, N=20), the success rate for task three was 0% with the average time taken at 8.41 seconds.
Task Four | Saving student session
The fourth task of the study asks participants to save a student session (above, right image, N = 20). The two successful areas include the add to my visit button and the more label. The exact task is “After viewing the student session information, you would like to save it for future use. Where would you go to save the student session?”
For task four (above, right image, N=20), the success rate for task three was 65% with the average time taken at 8.7 seconds. Thirteen participants clicked the add to my visit button. Two participants clicked the more label.
Study Two | Augmented Reality Campus
Task One | Viewing remote sessions
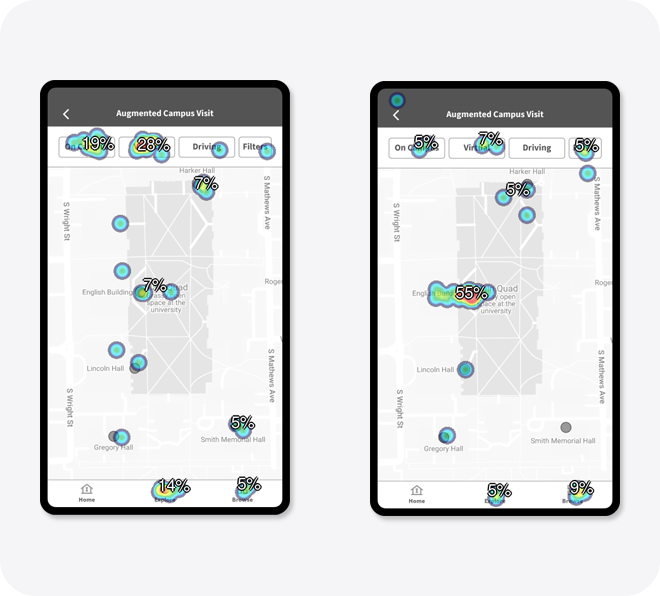
The first task of the study asks participants to view remote experiences (below, left image, N=42). The two successful areas include the virtual button and the filters button. The exact task is “You would like to view all locations since you are not on campus. Where would you go to view remote experiences?”
For task one (below, left image, N=42), the success rate for task one was 30.95% with the average time taken at 11.39 seconds. Twelve participants clicked the virtual button type. One participant clicked the filters button.
Task Two | Viewing AR experiences
The second task of the study asks participants to view remote experiences (above, right image, N=42). The successful areas include the English Building label, the on campus button, the virtual button, the driving button, and the filters button. The exact task is “You are interested in the English program. Where would you go to view AR experiences related to the English program?”
For task two (above, right image, N=42), the success rate for task one was 71.42% with the average time taken at 4.34 seconds. Twenty-three participants clicked the English Building Label. Two participants clicked the on campus button. Three participants clicked the virtual button. Two participants clicked the filters button.
Task Three | Setting location preferences
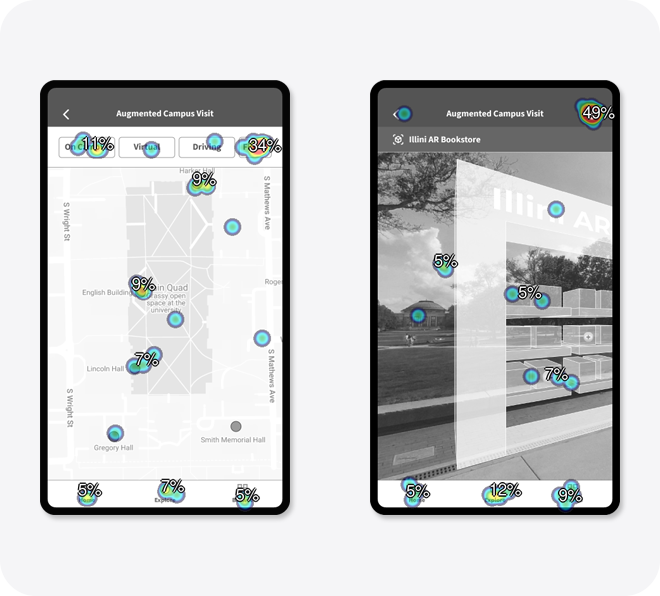
The third task of the study asks participants to set location preferences (below, left image, N=42). The successful areas include the on campus button, the virtual button, the driving button, and the filters button. The exact task is “You would like to view locations of a particular program? Where would you go to set location preferences?”
For task three (below, left image, N=42), the success rate for task three was 50.00% with the average time taken at 5.23 seconds. Fifteen participants clicked the filters button. Five participants selected the on campus button. One participant selected the driving button. One participant selected the virtual button.
Task Four | Sharing an AR experience
The fourth task of the study asks participants to share an AR experience (above, right image, N=42). The one successful area is the more icon. The exact task is “You would like to send the AR experience to a friend. Where would you go to share the experience?”
For task four (above, right image, N=42), the success rate for task three was 50% with the average time taken at 4.77 seconds. Twenty-one participants clicked the more label.
Study Three | Campus Audio Tour
Task One | Finding sessions
The first task of the study asks participants to find available sessions (below, left image, N=20). The two successful areas include the all categories dropdown and the class standing dropdown. The exact task is “While on the audio visit, you would like to listen to sessions on career perspectives of recent graduates. Where would you go to find available sessions on career development?”
For task one (below, left image, N=20), the success rate for task one was 10% with the average time taken at 8.52 seconds. Two participants clicked the class standing dropdown.

Task Two | Meeting with a student
The second task of the study asks participants to sign up to meeting with a student (above, right image, N=20). The successful area is the schedule visit button. The exact task is “After completing the audio tour, you would like to meet with a current student in your area of study. Where would you go to sign up to meet with a student?”
For task two (above, right image, N=20), the success rate for task one was 40% with the average time taken at 6.25 seconds. Eight participants clicked the schedule visit button.
Task Three | Accessing a saved session
The third task of the study asks participants access a saved session (below, left image, N=20). The all tags dropdown is the successful area. The exact task is “While completing the audio tour, you saved a session for future reference. Where would you go to access a saved session?”
For task three (below, left image, N=20), the success rate for task three was 0% with the average time taken at 7.37 seconds.

Task Four | Sharing a student session
The fourth task of the study asks participants to share a student session (above, right image, N=20). The one successful area is the more icon. The exact task is “After listening to the student session, you would like to send it to someone interested in the university. Where would you go to share the student session?”
For task four (above, right image, N=20), the success rate for task three was 40% with the average time taken at 4.91 seconds. Eight participants clicked the more icon.
DESIGN
Through the synthesis of usability study results, characteristics of content became relevant and timely design conditions for the Campus Visits section of the Illinois App. The aggregated usability studies dataset brought into focus the opportunity to establish a relationship between existing user interface components and the nomenclature of the application’s navigation. Emerging content consumption patterns expressed in the aggregated survey dataset illustrate the opportunity to build content creation pipelines for the new Campus Visits section of the Illinois App. The feedback contained in the aggregated usability studies communicated the opportunity to bring visibility to platform integrations at the university and partner levels.
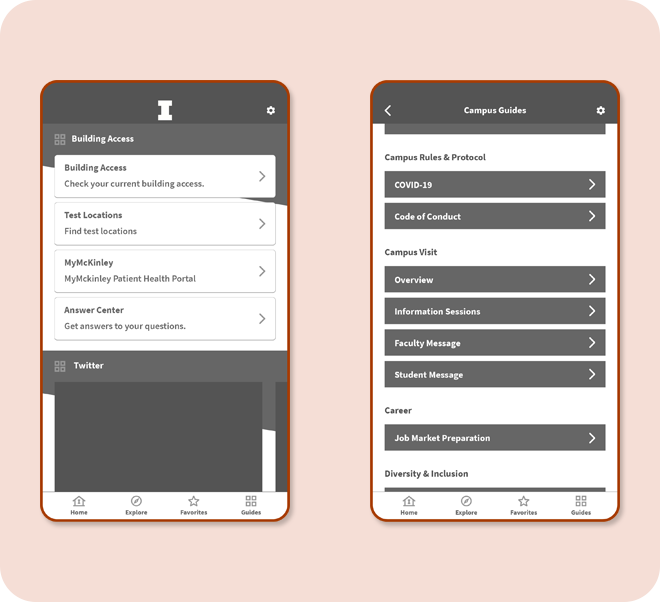
The content associated with campus visits is a new section the Guides section of the Illinois App using existing user interface components.

Relevant, timely, and transparent content augments the campus visit experience, whether in person or remote, by leveraging device capabilities.
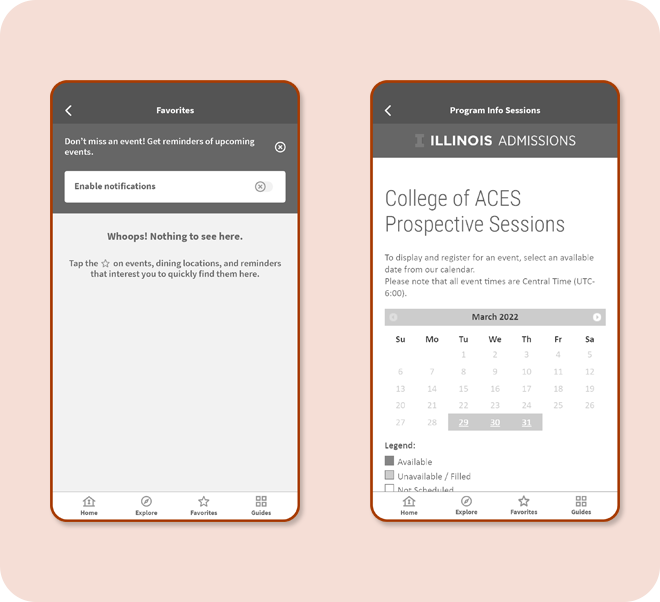
To prevent content overlap and redundancy, the Campus Visits section of the Illinois App accounts for ancillary content distribution and communication channels.
CLOSING THOUGHTS
The next steps of providing campus tour experiences for prospective students include gathering content from primary and secondary sources, conducting cross-campus stakeholder interviews, and creating additional wireframes. Meeting with campus partners in the Admissions department and academic college enrollment partners provides insights into current conditions of all elements of campus visit experiences. Based on defining key performance indicators and understanding technical capabilities, additional wireframes provide the opportunity to further refine conceptual direction. Building on an iterative design process, further research sessions with users and those affiliated with users provide additional insights to the creation of a delightful tour experience.
Project review committee
Rachel Switzky, Kathryn Courtney, Sandeep Puthanveetil Satheesan, Todd Nelson, Bill Sullivan, Vanessa Burgett, Natalie Helregel, Joseph Grohens, Bradly Alicea, Nickolas Vance, Mary Stevens, Jake Fava, Mel Fenner